Google




Return on equity is the metric everyone learns second, right after P/E. The reasoning is clean: a company that turns $100 of shareholder capital into $25 of profit is doing something better than one that turns it into $8. Screen for high ROE, own better businesses, earn better returns.
The first half of that is defensible. The second half is not, and the data says so plainly.
What ROE buckets actually returned
Every US-listed common stock in our database, grouped by current ROE, with median annualised price return:
| ROE | Stocks | 1 year | 5 year (p.a.) | 10 year (p.a.) |
|---|---|---|---|---|
| 25% or more | 949 | 6.05% | 2.55% | 10.87% |
| 15–25% | 627 | 14.72% | 10.83% | 12.46% |
| 8–15% | 962 | 20.69% | 8.70% | 9.95% |
| 0–8% | 1,193 | 6.57% | 0.23% | 5.82% |
| Negative | 2,560 | −11.62% | −18.50% | −2.38% |
The bottom of the table behaves exactly as expected. Companies losing money on shareholder capital lost their shareholders money: −18.50% a year over five years, −2.38% over ten. Nobody needs a database to be told that, but it is worth confirming that the metric is measuring something real before trusting the rest.
The top of the table is where the story breaks. The highest-ROE group is not the best-performing group. Over five years it returned 2.55% a year, against 10.83% for the merely-good 15–25% bucket — a gap of more than eight percentage points a year, in the wrong direction. Over ten years it still trails. Over one year it trails both of the groups beneath it.
The best five-year and ten-year returns in the whole sample came from the 15–25% band. The best one-year return came from 8–15%, which is a range most screeners would call unremarkable.
Two reasons a spectacular ROE is not a spectacular business
ROE is net income divided by shareholder equity. As with dividend yield, a big number can come from the numerator getting better or the denominator getting smaller — and shrinking equity is much easier than growing profit.
Leverage shrinks the denominator. Borrow to fund the business, and equity falls while profit does not. ROE rises without the company earning a cent more. In our sample, 13% of the 25%-plus ROE group carries debt-to-equity above 3, against 8% of the 15–25% group. Buybacks funded with debt do the same thing, which is why the metric is so easy to engineer.
The market has already noticed. This is the larger effect. 18% of the 25%-plus ROE group trades above 10 times book value — against 4% of the 15–25% group. Four and a half times the concentration. A famously high-return business is not a secret, and the price reflects that long before you screen for it. You are buying a superb company at a price that already assumes it stays superb, which leaves the return to come from surprises that are, by construction, unlikely.
| Trait | ROE 25%+ | ROE 15–25% |
|---|---|---|
| Debt-to-equity above 3 | 13% (122 of 949) | 8% (50 of 627) |
| Price-to-book above 10 | 18% (175 of 949) | 4% (25 of 627) |
What to do with this
Treat ROE as a filter, not a ranking. Its usefulness is almost entirely in excluding the bottom — the 2,560 companies with negative ROE, which lost money at every horizon and which no amount of cheapness fixed. Above roughly 15%, sorting descending is not adding information, and at the extreme it is actively selecting for leverage and for stocks that are already expensive.
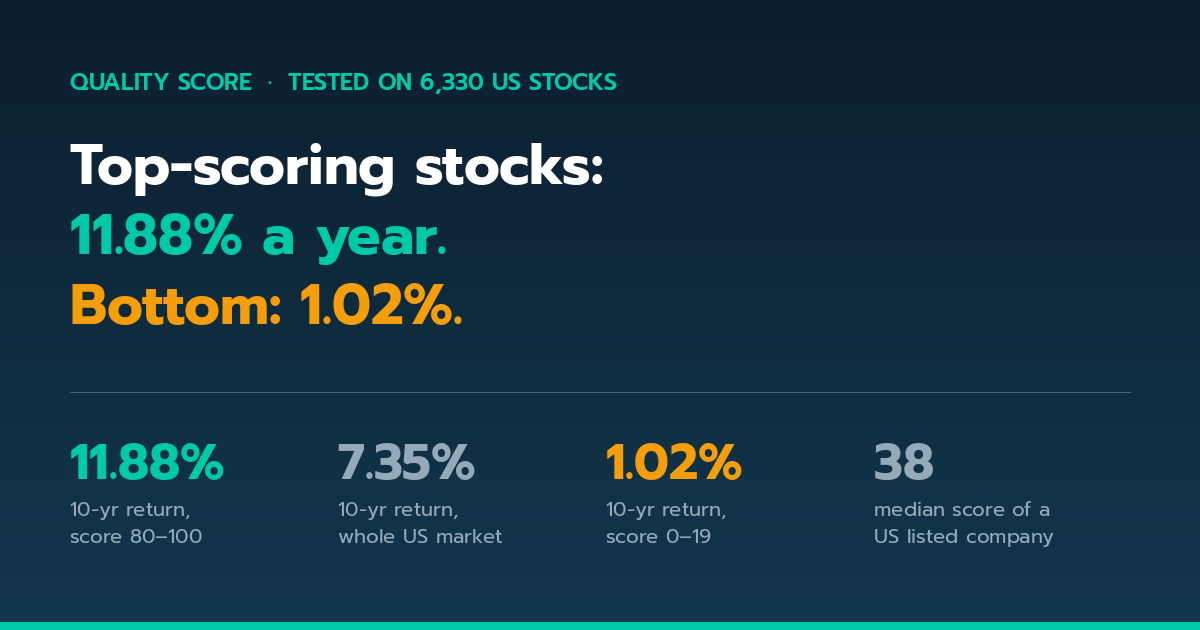
A more honest question than "who has the highest ROE" is "who has a good ROE that is not bought with debt, at a price that does not already assume perfection". That is three conditions, not one, which is precisely why a single-metric screen underperforms — and why our quality score combines profitability with leverage and valuation rather than ranking on any of them alone.
You can apply the three conditions together across the whole market on the quality screener, or browse every US-listed stock with ROE, P/E and P/BV side by side.
Frequently asked questions
What is a good ROE for a stock?
On this data the sweet spot is 15–25%, which produced the best five-year (10.83% p.a.) and ten-year (12.46% p.a.) median returns of any group. Above 25%, returns fall — largely because those companies are more leveraged and much more expensive relative to book value.
Is a higher ROE always better?
No. The 949 US stocks with ROE above 25% returned a median 2.55% a year over five years, against 10.83% for the 15–25% group. High ROE identifies good businesses; it does not identify good prices.
Why can ROE be misleading?
Because equity is the denominator. Debt and buybacks both shrink it, lifting ROE with no improvement in the underlying business. 13% of the highest-ROE group runs debt-to-equity above 3.
Should I avoid negative-ROE stocks?
The data is unambiguous on this one: the 2,560 companies with negative ROE posted a median −18.50% annualised over five years. That is the part of the metric worth acting on.
Method: computed from our own screening database covering 6,805 US-listed common stocks on NYSE, NASDAQ, NYSE American and ARCA, as of the latest completed session. Returns are median annualised price returns; ten-year figures cover the 3,246 companies with a ten-year history. Buckets are defined on current ROE, so this is a snapshot relationship rather than a backtest of a rebalancing strategy — a company in the 25%-plus bucket today was not necessarily there ten years ago.
Educational information only, not personalised investment advice. Figures are generated automatically, change as new data arrives, and past performance is not indicative of future results.