Google




Every stock site scores stocks. Ours does too. The fair response to any of them is: show me that the score has ever predicted anything.
So here is that test, run against our own numbers, with the result stated whichever way it comes out. The sample is every US-listed common stock we cover — 6,330 with a current quality score — grouped into five bands, with the median annualised return of each band at four horizons.
The result
| Quality score | Stocks | 1 year | 3 year (p.a.) | 5 year (p.a.) | 10 year (p.a.) |
|---|---|---|---|---|---|
| 80–100 | 274 | 14.35% | 17.60% | 11.37% | 11.88% |
| 60–79 | 1,174 | 12.82% | 13.08% | 7.68% | 10.71% |
| 40–59 | 1,613 | 7.09% | 5.15% | 1.95% | 8.37% |
| 20–39 | 2,711 | 0.00% | −5.72% | −10.31% | 3.53% |
| 0–19 | 558 | −8.74% | −6.45% | −12.26% | 1.02% |
Twenty cells. Reading down any column, the ordering holds — higher band, higher return — with one inversion, in the 3-year column between the bottom two bands. That is the honest description: monotonic at 1, 5 and 10 years, and monotonic at 3 years except at the very bottom.
The spread is the part worth sitting with. Over ten years, the top band returned 11.88% a year and the bottom band 1.02%. The market-wide median over the same period was 7.35%. Being in the top fifth was worth roughly 4.5 percentage points a year against the market; being in the bottom fifth cost roughly 6.3.
What the score is made of
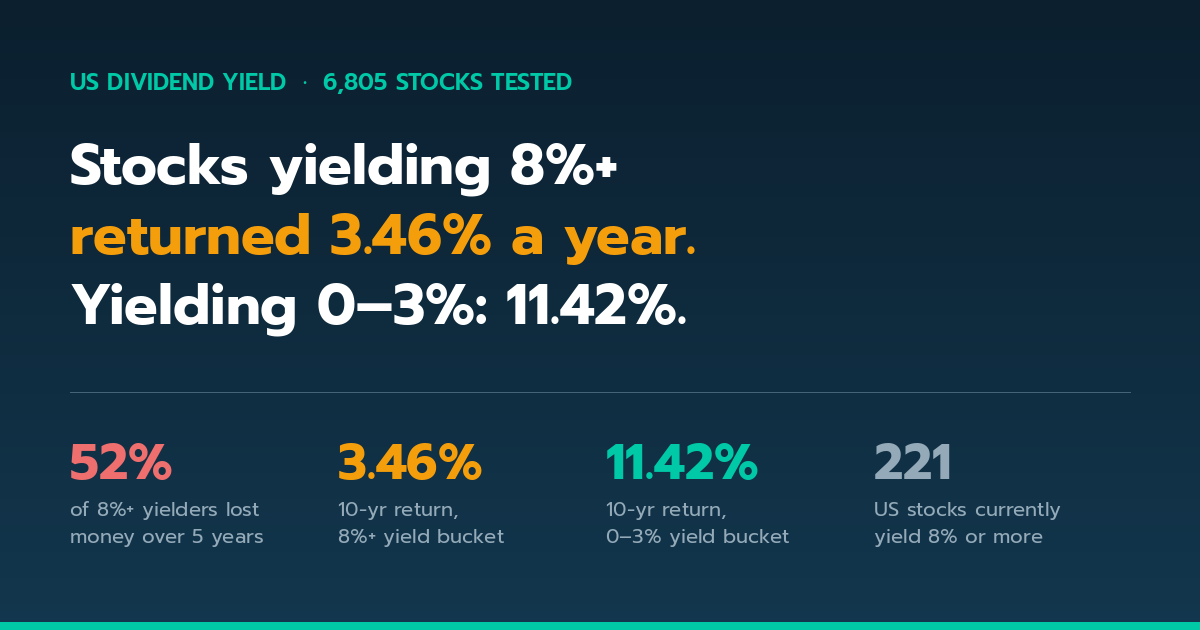
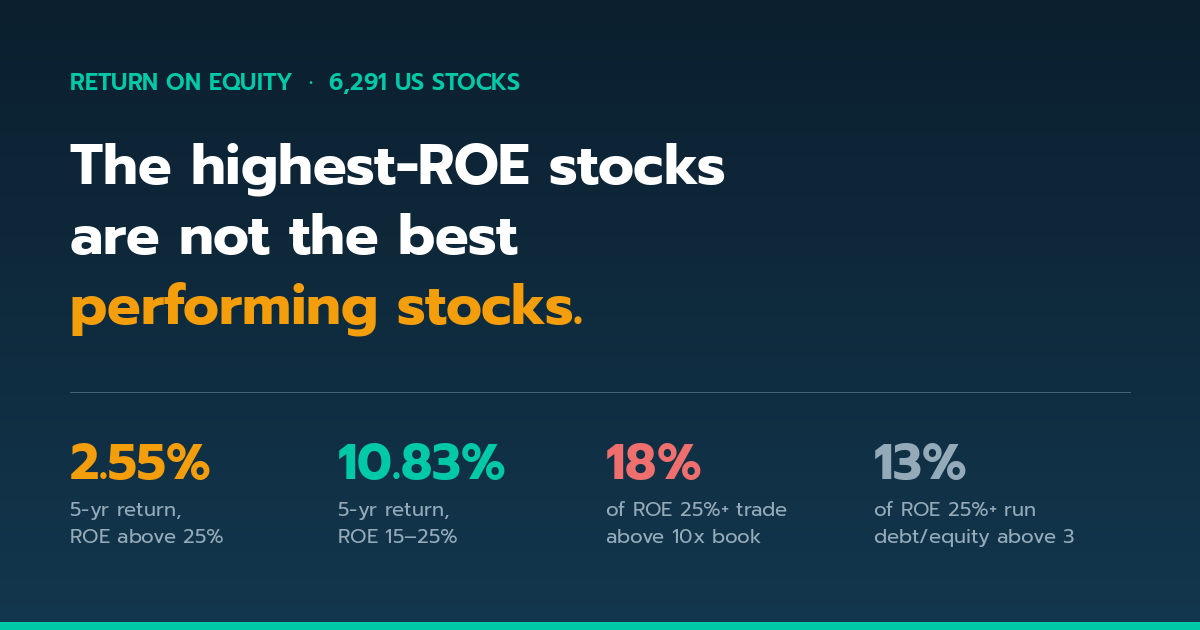
Nothing exotic — that is rather the point. It combines profitability (ROE, ROIC, margins), balance-sheet strength (debt, coverage, liquidity), earnings consistency across years, and valuation relative to the company's own sector. No single input can carry the score, which is deliberate: screening on ROE alone stops working above about 25%, and screening on dividend yield alone actively selects for falling prices. Every single-metric screen has a range where it inverts. Combining them is not sophistication for its own sake; it is the only way to stop each one from being gamed by its own denominator.
The distribution is unforgiving by design. Across the 6,330 US stocks with a score:
| Percentile | Score |
|---|---|
| 10th | 23 |
| 25th | 31 |
| 50th | 38 |
| 75th | 54 |
| 90th | 69 |
The median US listed company scores 38. A score of 70 puts a company in the top tenth of the market; only 274 companies out of 6,330 clear 80. If a screen tells you a third of the market is high quality, it is not measuring quality, it is measuring nothing.
Four things this test does not prove
Any result like this invites more confidence than it has earned, so:
- It is a snapshot, not a backtest. Companies are bucketed by their score today and matched to returns they earned in the past. A company scoring 85 now was not necessarily scoring 85 ten years ago. Some of the relationship is "good businesses stayed good", which is real, and some is "the score rewards what already went right", which is not tradeable.
- Survivorship is in there. Companies delisted during the period are not in the sample. That flatters the low bands more than the high ones — the worst outcomes are missing entirely — so if anything the true gap is wider than the table shows.
- Medians hide the individual case. A median of 11.88% does not mean a given 85-scoring stock returned 11.88%. Plenty in that band lost money. The score shifts a distribution; it does not deliver an outcome.
- Ten years is one market. One regime, mostly rising, with a specific rate environment. That is not enough history to call anything a law.
How to use it
As a first cut, not a decision. The strongest and most reliable signal in the table is not at the top — it is that the bottom two bands, 3,269 companies between them, posted negative five-year medians. Removing those from consideration is the highest-value move the score makes, and it requires no faith in the precision of the number at all.
Above that, treat the score as one input alongside whether you understand the business and whether the price already reflects the quality. You can screen the whole US market on it via the quality screener, browse every US-listed stock with its score, or read the full breakdown of what goes into the score.
Frequently asked questions
Do fundamental quality screens actually work?
On this sample, the relationship is consistent: US stocks scoring 80–100 returned a median 11.88% a year over ten years, against 1.02% for those scoring 0–19, with the ordering holding at 1, 5 and 10 years. That is evidence of a relationship, not proof of a repeatable edge — the caveats above matter.
What is a good quality score?
The median US listed company scores 38. Anything above 54 is top-quartile and anything above 69 is top-decile. Only 274 of 6,330 companies score above 80.
What was the median return of the US market?
7.35% a year over ten years, across the 3,246 companies with a full ten-year history. The top quality band beat that by roughly 4.5 points a year; the bottom band trailed it by roughly 6.3.
Method: computed from our own screening database covering US-listed common stocks on NYSE, NASDAQ, NYSE American and ARCA, as of the latest completed session. Returns are median annualised price returns. Sample sizes differ by horizon — 6,068 companies have a one-year return, 3,246 a ten-year — because younger listings have no long history. Companies are bucketed on their current score, so this measures association between present quality and past returns, not the result of trading the score.
Educational information only, not personalised investment advice. Figures are generated automatically, change as new data arrives, and past performance is not indicative of future results.