Google




Sort any US stock screener by dividend yield, descending. The names at the top will yield 9%, 11%, 14%. It looks like free money, and the instinct that follows is the same one everybody has: why would I take 2% when this pays 11%?
I ran the question against our whole US database — 6,805 listed common stocks — and grouped them by current yield, then looked at what each group actually returned. The answer is uncomfortable enough that it is worth being precise about.
The yield ladder, and what it earned
Median annualised price return by yield bucket. Medians rather than averages, because one 400% year in a bucket of 200 stocks moves an average and tells you nothing about the typical experience:
| Current yield | Stocks | 1 year | 5 year (p.a.) | 10 year (p.a.) |
|---|---|---|---|---|
| 8% or more | 221 | −5.29% | −0.28% | 3.46% |
| 5–8% | 244 | 6.65% | 0.49% | 3.60% |
| 3–5% | 409 | 16.63% | 4.42% | 6.10% |
| 0–3% | 1,110 | 27.84% | 10.94% | 11.42% |
| Pays nothing | 4,821 | −0.82% | −11.41% | 3.90% |
Read the first four rows in order. Every step up the yield ladder is a step down in return, at every horizon, without a single exception. The lowest-yielding payers returned 11.42% a year over a decade; the highest-yielding returned 3.46%. That is not a small gap — compounded over ten years it is roughly the difference between tripling your money and adding a third to it.
Why this is not a paradox
Yield is a fraction. Dividend divided by price. There are exactly two ways for it to get large, and only one of them is good news.
A company can raise the numerator — grow the payout because the business is generating more cash. Or the denominator can fall: the share price drops, and the yield printed on the screener rises to meet it, mechanically, while nothing good has happened at all. A stock that halves gives you a doubled yield on the way down.
The screener cannot tell those two apart. It shows the same 11% either way.
How often is it the bad kind?
Often enough that it should be your default assumption, not your edge case:
| Current yield | Share with a negative 5-year annualised return | Share scoring below 40/100 on fundamentals |
|---|---|---|
| 8% or more | 52% (96 of 183) | 47% (101 of 217) |
| 5–8% | 47% (96 of 203) | 37% (81 of 218) |
| 3–5% | 32% (118 of 369) | 39% (153 of 391) |
| 0–3% | 18% (186 of 1,018) | 29% (315 of 1,083) |
Better than half of the 8%-plus bucket lost money, annualised, over five years. Nearly half of it scores in the bottom two fifths of the market on fundamentals. If you had bought the top of a yield-sorted list at any point in that window, a coin flip decided whether the income covered the capital loss.
The part that gets missed
None of this says dividends are bad. The 0–3% bucket — companies that pay something modest and are still growing — beat every other group at every horizon, including the 4,821 stocks that pay nothing at all. Paying a dividend is a signal that a business generates cash it does not need to consume. Paying an enormous dividend relative to a falling price is a different signal entirely.
The useful reframe is that yield is an output, not an input. Screen on whether the business can sustain the payout — coverage, debt, whether earnings are growing or shrinking — and let the yield be whatever it turns out to be. Screen on the yield itself and you have sorted the market by "how far has this fallen recently", which is a strategy, just not the one you meant to run.
Three checks before any high-yield position
- Where did the yield come from? Pull up a five-year price chart. If the yield rose because the price fell, the payout is a symptom, not a feature.
- Can earnings cover it? A payout ratio above 100% means the company is paying you out of the balance sheet. That works until it does not.
- What does the balance sheet look like? Debt-funded dividends are the most common way a 12% yield becomes a 0% yield in one announcement.
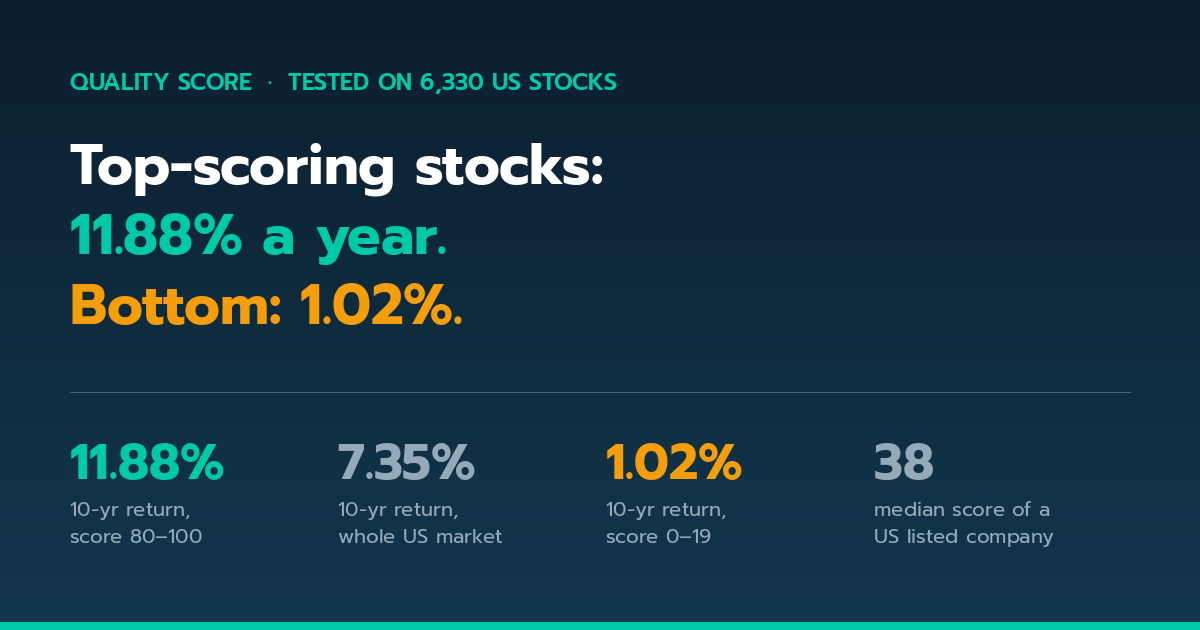
You can run those three against the whole US market on the quality screener, or start from the dividend screen and sort by fundamentals rather than by yield. If you want the same analysis for a market where the income opportunity is genuinely wider, 49% of Thai listed companies yield above 3%, against 13% in the US — with the same trap, in a bigger version.
Frequently asked questions
Is a high dividend yield a bad sign?
Not automatically, but the base rate is poor. Among US stocks yielding 8% or more, 52% delivered a negative annualised return over five years and 47% score in the bottom two fifths of the market on fundamentals. The yield alone does not distinguish a growing payout from a collapsing price.
What dividend yield is actually sustainable?
Rather than a threshold, look at coverage. The best-performing group in this data was the modest one — stocks yielding between 0% and 3% returned a median 11.42% a year over ten years, more than three times the 8%-plus bucket.
Do dividend stocks beat non-payers?
In this sample, yes, but only the moderate payers. Companies yielding 0–3% beat the 4,821 non-payers at every horizon measured. Companies yielding above 5% did not.
Method: all figures are computed from our own screening database covering 6,805 US-listed common stocks on NYSE, NASDAQ, NYSE American and ARCA, as of the latest completed session. Returns are median annualised price returns; sample sizes differ by row because not every company has a ten-year history, and each row states its own n. Buckets are defined on current yield, so this is a snapshot relationship, not a backtest of a rebalancing strategy.
Educational information only, not personalised investment advice. Figures are generated automatically, change as new data arrives, and past performance is not indicative of future results.