Google




Most "high dividend" screens run on US listings end up in the same neighbourhood: a few REITs, some utilities, a tobacco name, a couple of telecoms. The reason is not that screeners are badly built. It is that the US market simply does not have many high yielders left.
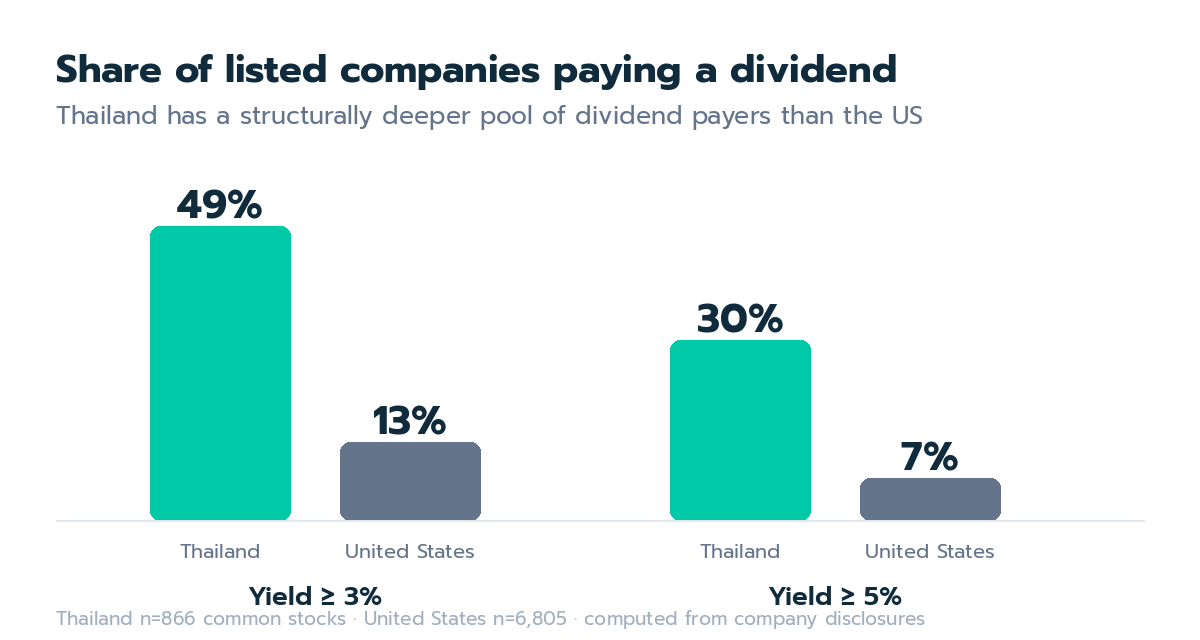
I counted. Across 6,805 US-listed common stocks, 13% yield 3% or more. Across Thailand's 866, the figure is 49%.
That is not a small difference in degree. It is a different market structure, and it is the single strongest reason for an income investor to look at Thailand at all.
The comparison, in full
| Thailand | United States | |
|---|---|---|
| Common stocks with a yield figure | 866 | 6,805 |
| Yielding ≥ 3% | 426 (49%) | 874 (13%) |
| Yielding ≥ 5% | 256 (30%) | 465 (7%) |
| Median dividend yield | 2.83% | 0.00% |
The median row is the one that surprises people. More than half of all US-listed common stocks pay no dividend whatsoever — which is why the median lands on zero. In Thailand the median company pays 2.83%.
Nearly one in three Thai listed companies yields above 5%. In the US it is one in fourteen.
Why the gap exists
Two structural reasons, neither of them a market inefficiency you can arbitrage away — and both visible in the shape of the market itself.
Payout culture. Thai listed companies, particularly the large family- and state-linked ones, have long distributed a high share of earnings. Dividends are treated as a standing obligation to shareholders rather than as the residual after reinvestment.
Composition. The US listed universe is heavily weighted toward growth-stage companies that deliberately retain everything — the thousands of software, biotech and recently-listed names that make up much of the count. Thailand's listed universe skews toward banks, utilities, telecoms, property and industrials: mature businesses in mature domestic markets, with less to reinvest into.
Neither of those is temporary, which is what makes the gap worth building a strategy around rather than trading around.
The part most yield lists get wrong
A high yield is a ratio, and ratios move for two very different reasons. The dividend can go up, or the price can fall. A screen sorted by yield descending puts the second group at the top.
The failure mode has a name — a dividend trap — and it is not rare here. Screening Thai listings for a bare yield above 5% returns 256 names. Requiring that the company actually paid a dividend in each of the prior three years, and that its financial quality clears a threshold, cuts that to a small fraction.
The two highest-yielding Thai securities on a naive sort right now show yields of 26.5% and 18.0%. Both paid zero in each of the two preceding years. Nothing in the yield number tells you that. Only the payment history does.
So the practical screen is three tests, not one:
- Yield above your threshold — the starting filter, and the least informative of the three
- Paid in each of the last three years — this is what separates a dividend from an accident
- Financial quality above a bar — a company that cannot fund the payout will stop making it
Applying all three to Thai listings: 204 companies combine a yield of 3% or better with a quality score of 60 or above. At a 5% threshold, 137.
That is still a far larger opportunity set than the equivalent US screen produces — which is the actual point. Thailand's advantage survives the quality filter.
The cost side, stated plainly
Higher yields do not arrive free, and any article that stops at the good number is selling something.
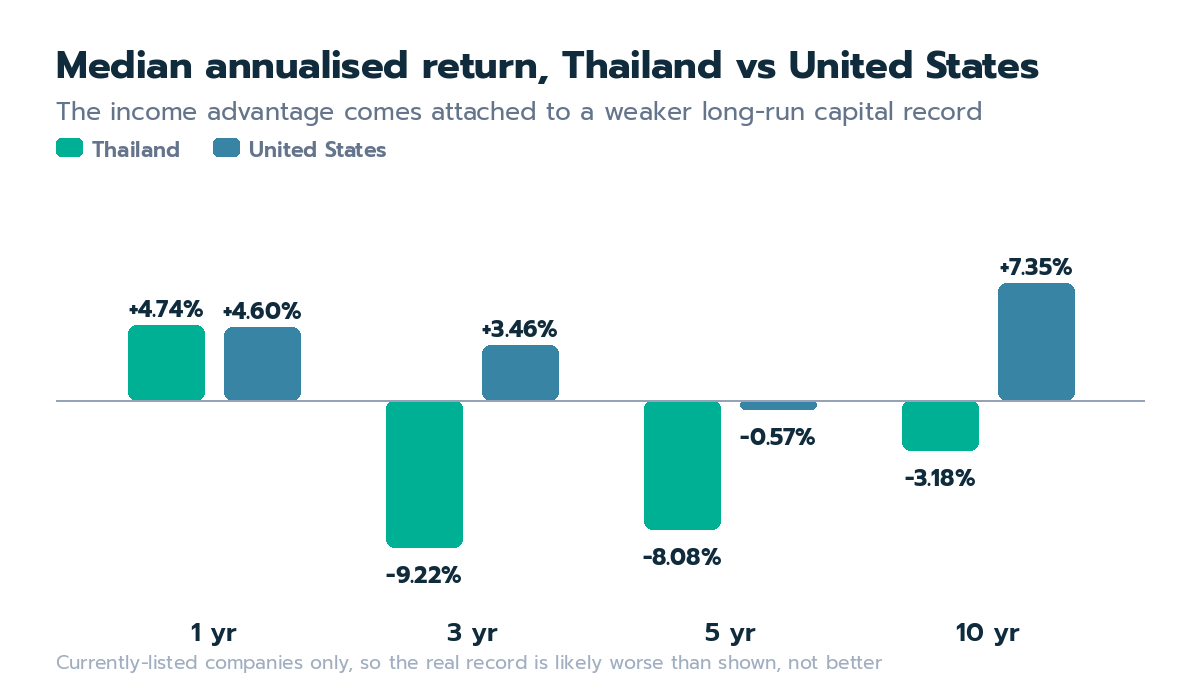
| Median annualised return | Thailand | United States |
|---|---|---|
| 1 year | +4.74% | +4.60% |
| 3 years | −9.22% | +3.46% |
| 5 years | −8.08% | −0.57% |
| 10 years | −3.18% | +7.35% |
Over five years, 29% of Thai listed companies delivered a positive average annual return. In the US, 49% did.
So the honest framing is: Thailand pays you more income while the capital side has done worse. Whether the income compensates depends on the individual company, your holding period and your currency. It is not answered by the yield alone, and anyone who tells you the market is "cheap and yielding 5%" without showing you this table is showing you half the data — why Thai stocks trade below book covers the other half.
One methodological note: these figures cover companies still listed today. Businesses that delisted or failed are not in the sample, so if anything the real record is worse than shown, not better.
How to work through it
If you want to explore this yourself rather than take the summary on faith:
- All Thai stocks — the complete list with yield, P/E, ROE and quality score, sortable by market cap
- High dividend stocks screened for quality — the three-test screen above, run daily
- All US stocks — the same fields, for comparison
Summary
Thailand offers something the US market structurally does not: a broad, deep set of dividend payers rather than a short list of survivors. 49% versus 13% at the 3% threshold is a real edge for an income mandate.
It comes attached to a weaker long-run capital record, and to a dividend-trap problem that a yield-sorted list will walk you straight into. Both are manageable — but only if you screen on payment history and financial quality, not on the yield number that got your attention in the first place.
This article is for education and general information only and is not personalised investment advice, and does not recommend any specific security. All figures are generated automatically from data disclosed by listed companies as at the date of publication and change over time. Return data covers companies currently listed and therefore carries survivorship bias. Dividend yields are historical and do not indicate future payments. Past performance is not indicative of future results. Investors should do their own research and assess their own risk tolerance before making any investment decision.